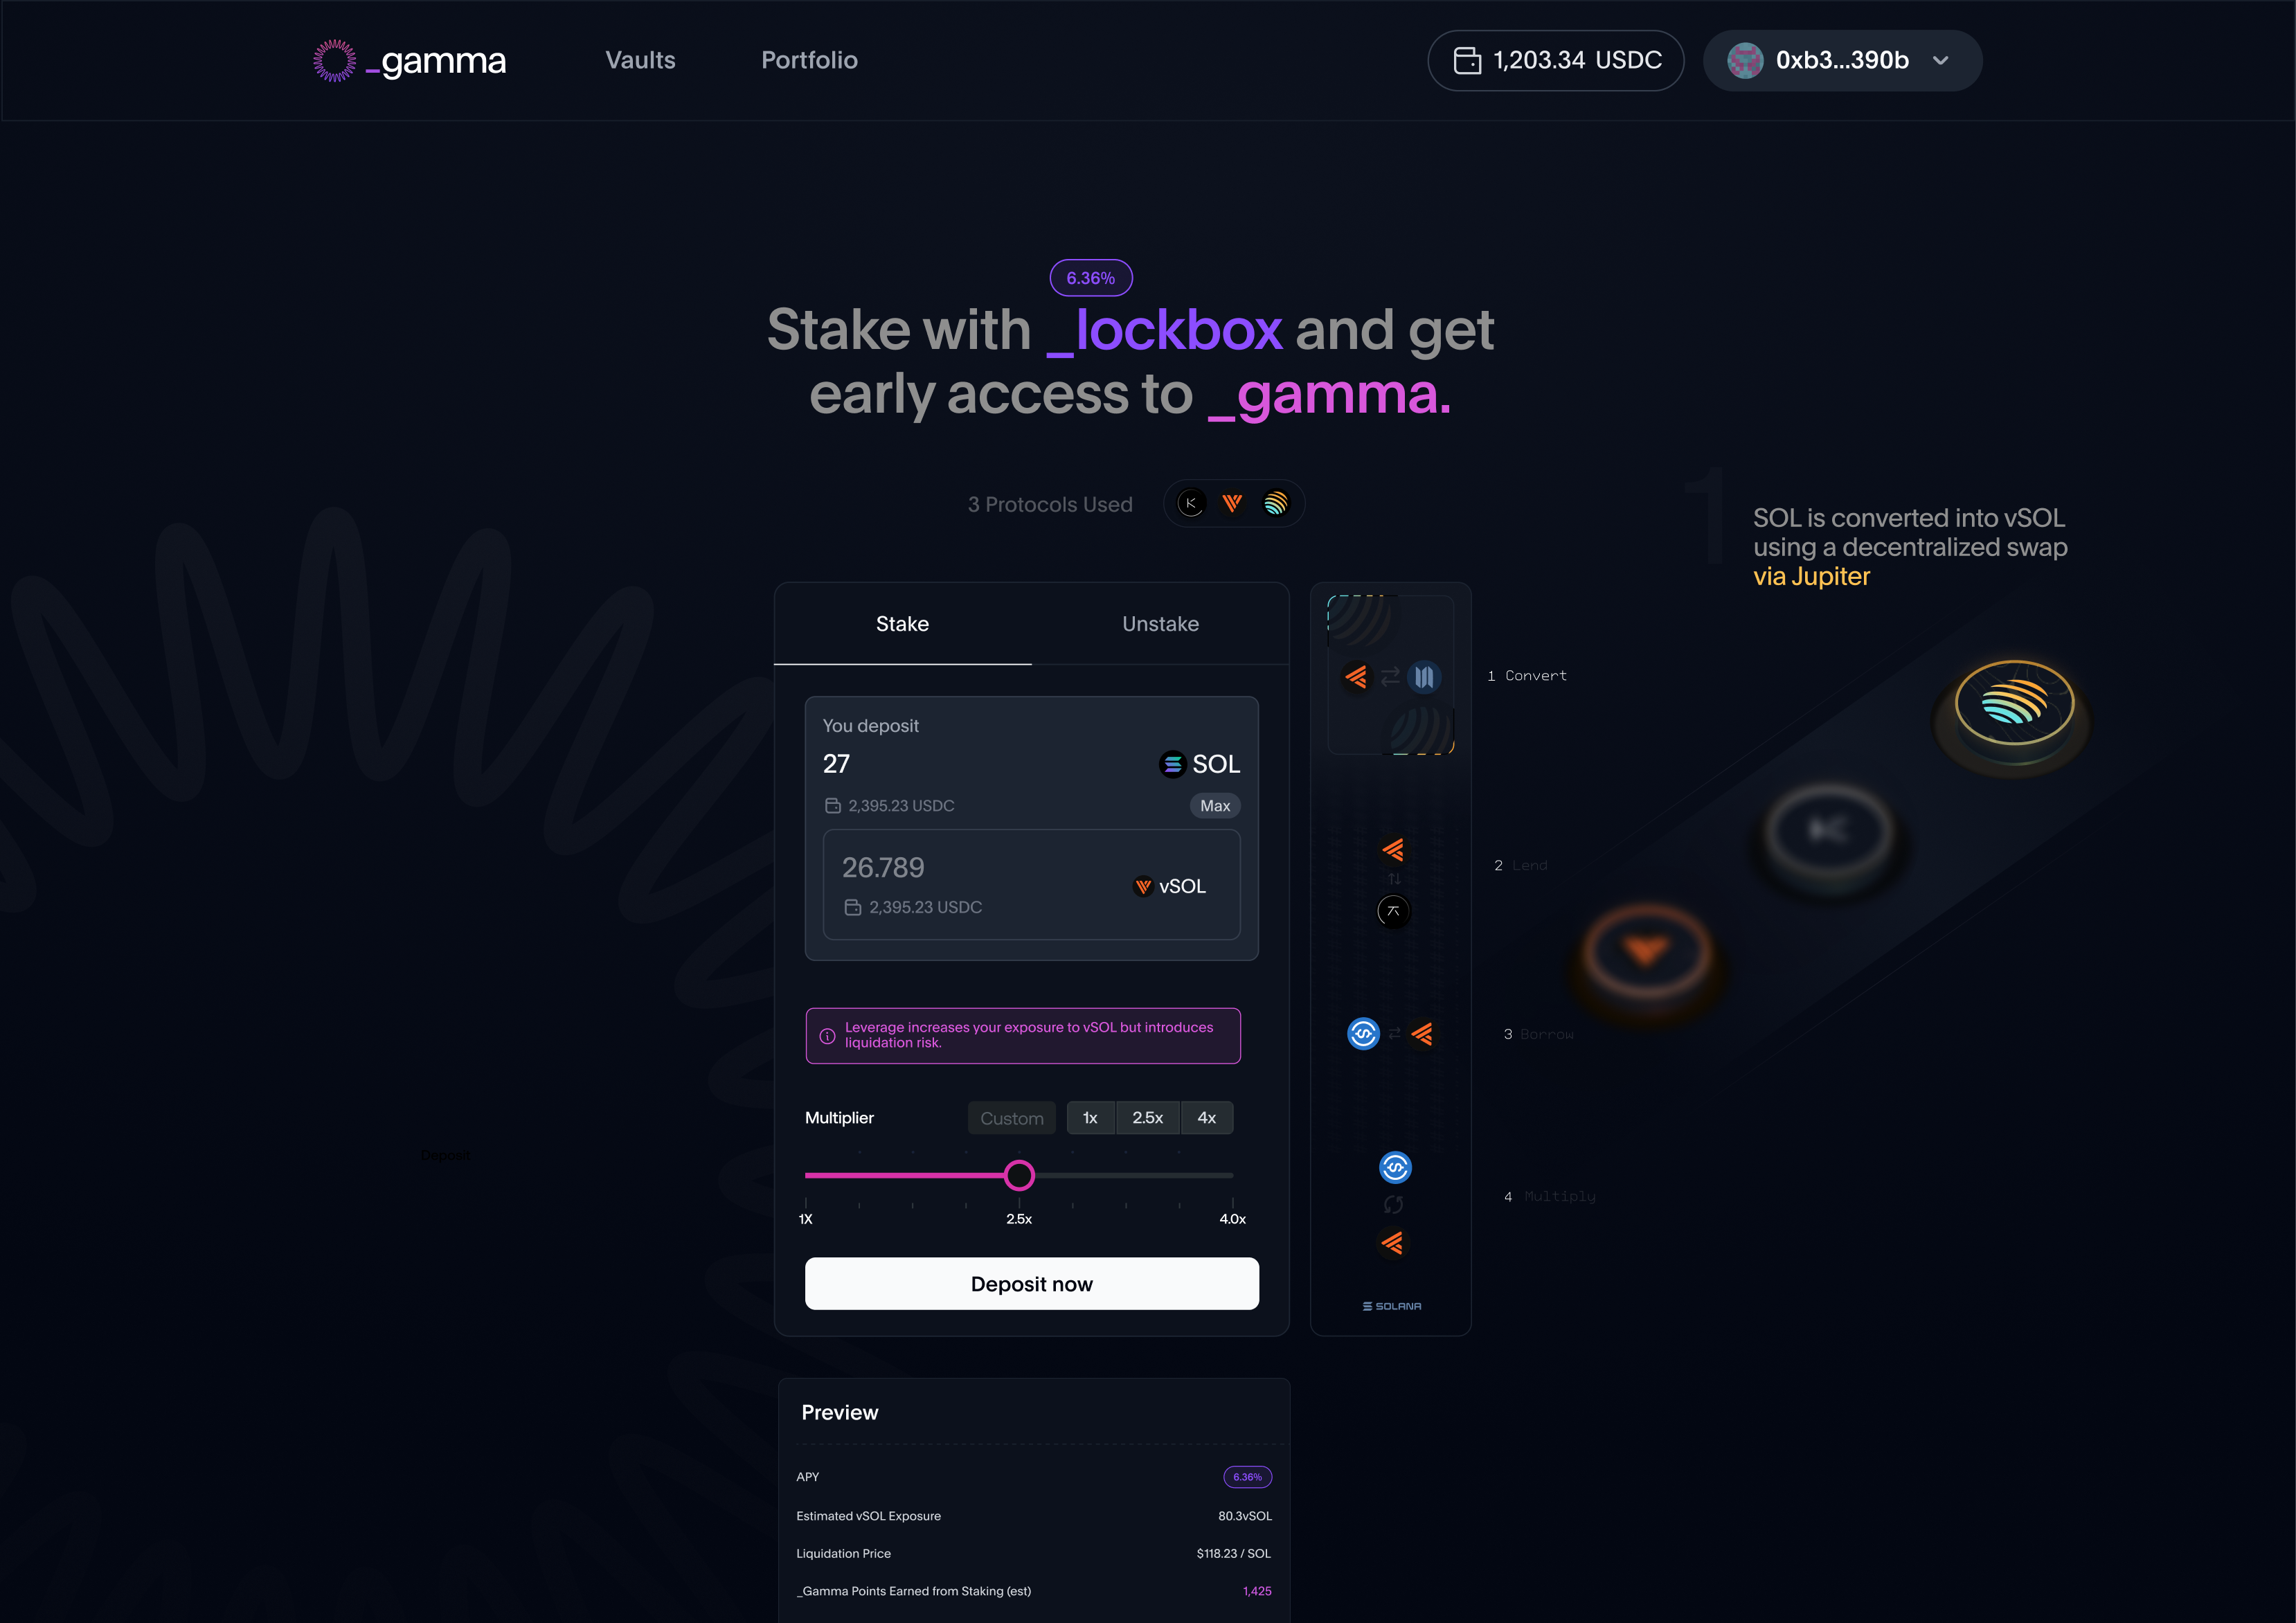
Gamma Lockbox staking and early-access product experience

BRAND · PRODUCT · LAUNCH · 2023–2025

Gamma

Designed Fibonacci's realtime data product, then extended Gamma's automated DeFi platform

Timeline
2023–2025
Role
Product & Brand Designer - Fibonacci / Gamma
Fibonacci product
0→1
investor dashboard
Realtime
Process & contextStrategy, decisions, outcomes, chronology, and sources

Context

Fibonacci had a deep institutional-grade crypto dataset but needed a consumer-facing product model, identity, and onboarding path that retail investors could understand. Gamma later had an existing component library and core product direction, but its early-access, agent, and portfolio surfaces needed to work as one coherent system. The marketing story also needed to explain why users should lock in before entering the full product.

Product decision

For Fibonacci, organize realtime data around configurable dashboards, reusable market signals, model detail, and a clear account-creation path instead of exposing the dataset as an API catalog. For Gamma, build from the established library, introduce new components only where the next product phase required them, and use the same language across the waiting room, Lockbox / lock-in campaign, onboarding, and dashboard.

Outcome

Fibonacci became a coherent branded data product with modular realtime dashboards for retail investors, risk-model detail, and a complete authentication system. I then implemented Gamma's next phase without treating it as a clean-sheet redesign: new product patterns clarified agent setup and portfolio state, while the campaign copy connected acquisition to the experience users encountered after onboarding.

0→1
Fibonacci product

Designed the dashboard experience, model views, onboarding, and visual system from the dataset outward.

Realtime
investor dashboard

Translated live market and liquidity data into configurable views for retail investors.

2024
partial acquisition

Squads Labs publicly announced a partial acquisition of Fibonacci Finance's codebase.

Extended
existing library

Built on the established component foundation rather than replacing it.

Added
new components

Introduced the patterns and flows required for the next platform phase.

Led
copy + campaign

Led key marketing language and the Lockbox / lock-in campaign.

Key decisions

Turn a dataset into a decision surface

Fibonacci's value lived in realtime market data. Modular dashboards let retail investors choose an asset once, assemble the signals they needed, compare chains, and move from overview to model detail without navigating an API catalog.

Let identity explain the product

The Fibonacci redesign used a living radial data object, dark analytical fields, and a restrained spectrum to connect the brand promise of decentralized alternative data to the product's charts, states, and onboarding.

Extend before replacing

Gamma already had a component library and product direction. New work inherited that foundation so the next phase felt continuous instead of like a separate redesign.

Make automation inspectable

Agent setup, strategy parameters, activation, performance, and next actions made the autonomous model readable rather than presenting it as a black box.

Keep portfolio state operational

Overview, positions, tokens, analytics, and risk views separate tasks while preserving a consistent account and exposure model.

Carry one promise through the funnel

Lockbox language, early access, points, referrals, and leaderboard states connect campaign acquisition to the product users encounter next.

Project chronology

From Fibonacci's data product to Gamma's automated portfolio system

The chronology separates two bodies of work rather than presenting them as one redesign: Fibonacci began with a dataset and a new retail-facing product model; Gamma began with an established library that I extended into its next phase.

01 / 02

Fibonacci

Fibonacci was the earlier data-product chapter. I redesigned the brand, researched how retail investors use modular crypto analytics, and designed the realtime dashboard UX/UI from scratch around Fibonacci's dataset - including dashboard creation, asset and signal selection, model detail, account creation, and authentication. Squads Labs later announced a partial acquisition of Fibonacci Finance's codebase in May 2024.

01

A data product, not an API catalog

Fibonacci's dataset could describe liquidity, risk, market structure, and model performance in realtime. I designed the product layer that made that information usable by retail investors: a system for moving from a market signal into an inspectable model and its performance over time.

Model detail - methodology, price state, risk metrics, performance, and action in one analytical surface.

02

Research the investor's comparison model

The UX notes benchmarked modular analytics products and identified a clearer product model for Fibonacci: choose an asset once, assemble signals into a dashboard, preview realtime data, compare chains, retain historical events, and expose liquidation levels when they change the decision.

Competitive UX comparison - translating proven modular-dashboard behavior into Fibonacci's realtime data context.

03

Redesign the identity around living data

I rebuilt the brand around a radial data object that could read as a network, signal, lens, or field. The dark analytical world, restrained spectrum, and orbital motion gave the API, marketing site, dashboard, and onboarding one recognizable visual grammar.

Fibonacci landing experience - decentralized alternative data, product value, API language, and dashboard preview.

04

Make realtime data configurable

The main dashboard kept the selected market, time range, source context, data confidence, and live visualizations in one workspace. The UX mockups used Matplotlib as the proposed visualization layer, applying its charting library to display distinct segments of the Fibonacci dataset across TVL, volume, price, slippage, pool composition, and other signals without rebuilding context for every chart.

Realtime dashboard - configurable Matplotlib visualizations across distinct segments of the Fibonacci dataset.

05

Create a dashboard from the signal outward

The creation flow starts with the asset, then lets the investor select the evidence that belongs in the view. Explanations and previews sit beside the choices so advanced measures such as pool composition, historical slippage, efficiency, and Sortino ratio remain understandable before they enter the dashboard.

Dashboard builder - asset selection, metric selection, explanatory preview, and next-step state.

06

The complete creation canvas

The vector source preserves the wider create-dashboard state at inspection quality, including token discovery, popular-market context, alerts, and account navigation.

Create Dashboard - full-resolution vector product canvas. Open PDF ↗

07

Carry the product world through authentication

I adapted the account-creation system to Fibonacci rather than dropping users into a generic identity provider. Login, social authentication, password states, and signup inherit the same orbital data world as the public site and dashboard.

Authentication entry - email and social login in the Fibonacci product world.
Account creation - focused credential state with a continuous return path to login.

08

The working product UI

The source file contains the dashboard, model, creation, account, and visual-system states behind this chapter at their original resolution.

Fibonacci UI - realtime dashboard and product system.

09

Fibonacci Brand Guidelines

The complete identity system documents the radial mark, typography, data-world imagery, motion logic, color, and the rules that connected the brand to the product experience.

Fibonacci Brand Revision - live Figma guidelines file.

2026 CONNOR LEE

LOS ANGELES, CA